Business performance
The Business Performance Module in the Coupa Supplier Portal gives you insights into your transactions with your Coupa customers. This is intended to help you to drive efficiencies in your accounts receivable & shipping processes, leading to better customer relationships.
Get a summary of your Coupa customer orders & invoices that need your attention as well as year-to-date order, invoice, and delivery time trends.
Note: The data provided is directional and for informational purposes only, and may be delayed up to one to two weeks.
View the Order/Invoice Summary Dashboards
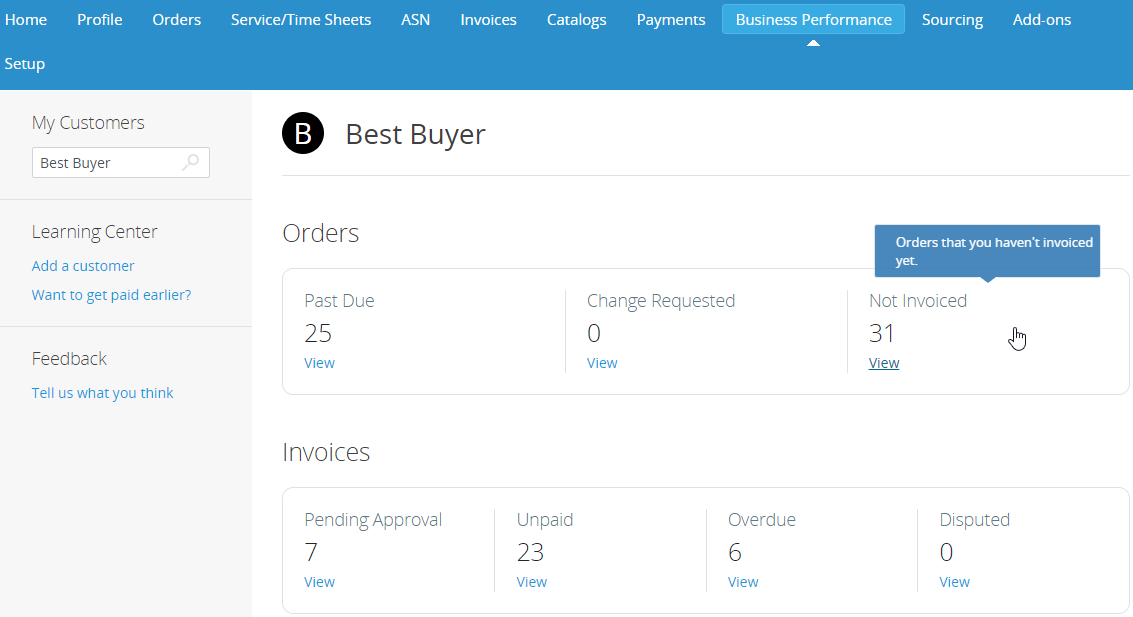
Click on the Business Performance tab in the top menu.
In the top left corner, select from the list or search for the customer for which you want to see performance data.
The selected customer name appears at the top of the page and below it, you can see a summary (with numbers and status) of your orders and invoices that need attention.
Clicking on the View links takes you to the Orders or Invoices page, respectively, showing only the list of orders/invoices relevant to the status selected to view.
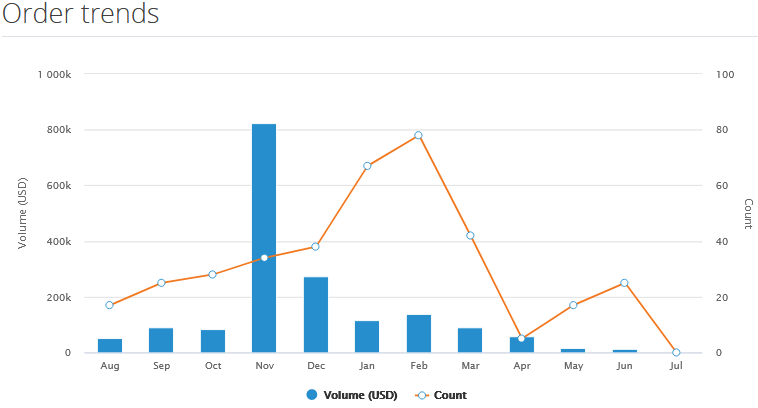
View Order Trends
Below the summary dashboards, you can find graphs for order for the past 12 months.
The order graphs show the volume/amount and count/number of your orders/invoices by month.
Hover your cursor over Volume or Count in the legend to highlight the relevant data.
Hovering your cursor over the volume bar or count line shows you the volume or count of orders/invoices by month.
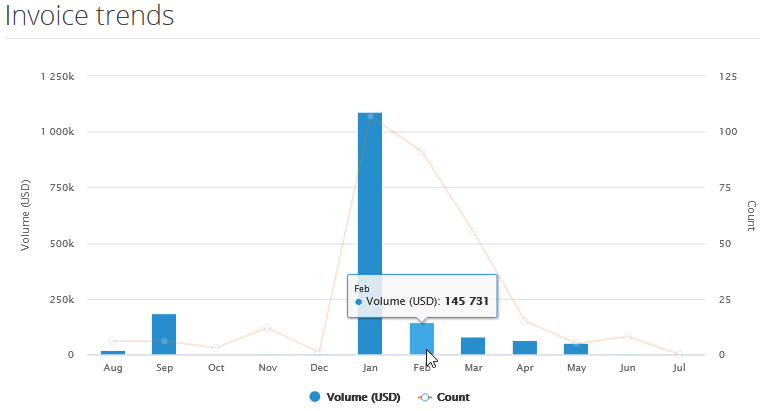
View Invoice Trends
Below the summary dashboards, you can find graphs for invoices for the past 12 months.
The invoice graphs show the volume/amount and count/number of your invoices by month.
Hover your cursor over Volume or Count in the legend to highlight the relevant data.
Hovering your cursor over the volume bar or count line shows you the volume or count of invoices by month.
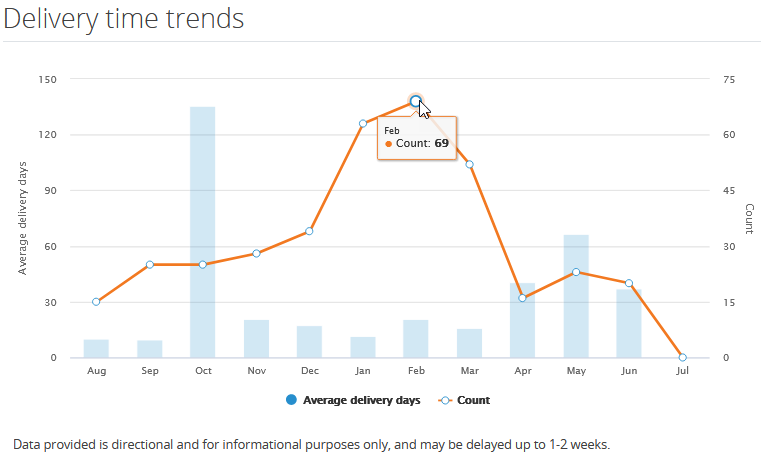
View Delivery Time Trends
Below the summary dashboards, you can find graphs for delivery time trends for the past 12 months.
Delivery time trends show the average delivery days (time in days between the order date and the receipt date) and the number of orders delivered by month. Hover your cursor over the graph to see details.